The "Everything Is a File" Philosophy in Linux
To build a Linux process monitor, you don't need complex system calls or C bindings. You just need to know how to read a text file.
When I built topgo, a terminal process monitor in Go, I discovered that utilities like top and htop don't use specialized APIs. They rely entirely on a core Unix design principle: everything is a file.
The Uniform Interface
When Linux says "everything is a file," it means the kernel exposes almost every hardware and software resource as a file stream.
Your hard drive is a file (/dev/sda). Your keyboard is a file. A network connection is a file. Because they are all treated identically, they share the exact same interface: open(), read(), write(), and close(). You don't need a custom library to interact with a keyboard; standard file operations work everywhere.
This uniform interface is exactly why you can pipe the output of one program directly into another. They are simply reading and writing from file streams.
Enter /proc
The engine behind topgo is /proc.
If you cd into /proc and run ls, you'll see hundreds of numbered directories (one for each running process), plus a handful of system files:
$ ls /proc
1  2  3  ...  cpuinfo  meminfo  uptime
/proc is not stored on disk. It is a virtual filesystem created dynamically by the Linux kernel and lives entirely in RAM. When you run cat /proc/uptime, the kernel intercepts the request, calculates the system uptime, formats it as text, and returns the stream.
String Parsing Over System Calls
Extracting system metrics is simply string parsing. To get global CPU usage, I open /proc/stat and read the values space by space:
file, err := os.Open("/proc/stat")
if err != nil {
    return 0, 0, err
}
defer file.Close()

scanner := bufio.NewScanner(file)
for scanner.Scan() {
    line := scanner.Text()
    if strings.HasPrefix(line, "cpu ") {
        fields := strings.Fields(line)
        // fields[1] through fields[10] contain the raw CPU ticks
        break
    }
}
If you run cat /proc/stat in your terminal, the output looks like this:
$ cat /proc/stat
cpu  577 11 1348 34737 292 0 227 0 0 0
cpu0 30 0 135 2875 16 0 66 0 0 0
cpu1 194 4 216 2535 98 0 73 0 0 0
...
The kernel doesn't provide a clean CPU percentage. These numbers are just a running counter of "ticks" since the computer booted, tracking time spent in user mode, system mode, and idle time (proc_stat(5) defines each column).
When I first wrote the CPU parsing logic I tried to just read the ticks and divide by the uptime. That yielded completely useless numbers. I had forgotten that to get the current CPU usage, you have to read the ticks, sleep for a fraction of a second, read them again, and calculate the delta.
I use the exact same approach for process specific metrics. For example, to find a process's actual memory footprint, I read its /proc/<PID>/status file.
If you look inside this file, you'll find a metric called VmRSS (Virtual Memory Resident Set Size). This represents the exact amount of physical RAM the process is currently occupying:
$ cat /proc/self/status | grep VmRSS
VmRSS:      4680 kB
By parsing this single line and converting the kilobytes, topgo can accurately display the memory consumption of any running application. Similarly, to find the command that started a process, I simply read its /proc/<PID>/cmdline file.
How File Descriptors Connect It All
The mechanism holding this together is the file descriptor (FD). Whenever a program opens a file, network socket, or pipe, the kernel returns an integer representing that stream.
Every Linux process starts with three file descriptors automatically open:
- FD 0: Standard Input (
stdin) - FD 1: Standard Output (
stdout) - FD 2: Standard Error (
stderr)
When you run echo "hello" > log.txt, your shell simply takes FD 1 (which normally points to the screen) and redirects it to log.txt before executing echo. The echo command has no idea it is writing to a file; it just writes to FD 1 as usual.
We can actually prove this by listing the file descriptors for the current process (/proc/self/fd) and redirecting that output to a file:
$ ls -l /proc/self/fd > log.txt
$ cat log.txt
total 0
lr-x------ 1 user user 64 Apr 27 17:36 0 -> /dev/pts/0
l-wx------ 1 user user 64 Apr 27 17:36 1 -> /home/user/log.txt
lrwx------ 1 user user 64 Apr 27 17:36 2 -> /dev/pts/0
lr-x------ 1 user user 64 Apr 27 17:36 3 -> /proc/466/fd
Notice how FD 1 is pointing directly to log.txt. The ls command simply wrote its standard output to FD 1, completely unaware that the shell had temporarily wired it to a text file.
This underlying architecture has real world consequences. For example, if you build a system monitor like topgo and want to count open file descriptors by reading /proc/<PID>/fd, you'll run into a wall with system daemons or processes running as root. The kernel enforces strict security permissions you can only read the FDs of your own processes. To inspect the FDs of kernel processes, you have to run your monitor with sudo.
This also explains why web servers crash with a "too many open files" error despite having plenty of RAM. Every active user connection requires a network socket, and every socket is a file occupying a file descriptor slot.
Traditionally, Linux has enforced a soft limit of just 1,024 open files per process. You can check your current limit by running ulimit -n. To handle high traffic, you can temporarily increase this limit in your current shell session using ulimit -n 65535. For a permanent fix, you'll need to edit /etc/security/limits.conf.
Why It Matters
The "everything is a file" model can feel like an outdated Unixism until you actually have to build system tooling. By exposing processes, memory, and hardware as plain text streams, Linux eliminates the need for massive SDKs just to see what the machine is doing.
Writing a process monitor ultimately became an exercise in standard file I/O and string manipulation.
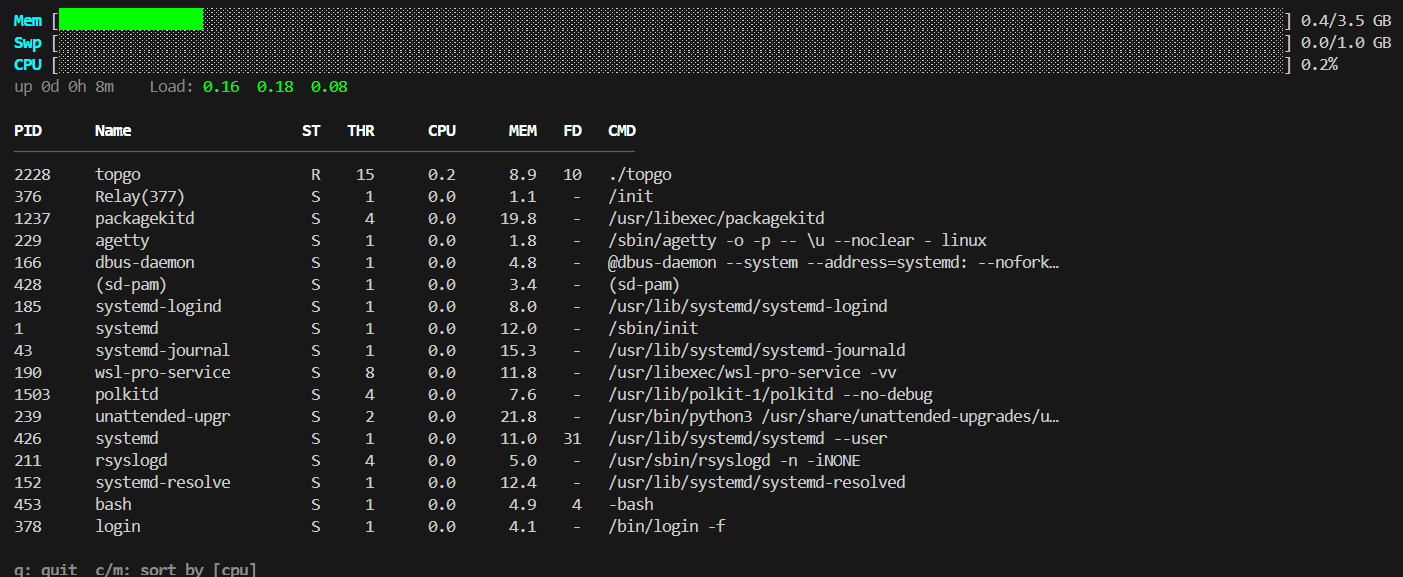
If you're curious about how the actual /proc parsing code turned out, you can check out the source on GitHub.